체크포인트
Create a dataset
/ 25
Create a table from query results
/ 25
Perform a transformation on BiqQuery data
/ 25
Create a stored procedure to ensure easier updates
/ 25
Creating and managing SQL pipelines
 IMPORTANT:
 Make sure to complete this hands-on lab on a desktop/laptop only.
 There are only 5 attempts permitted per lab.
 As a reminder – it is common to not get every question correct on your first try, and even to need to redo a task; this is part of the learning process.
 Once a lab is started, the timer cannot be paused. After 1 hour and 30 minutes, the lab will end and you’ll need to start again.
 For more information review the Lab technical tips reading.
Activity overview
A data pipeline is a series of processes that transport data from different sources to a destination for storage and analysis.
Data pipelines can increase the performance and efficiency of data transformation by automating the flow of data and streamlining how data is handled.
Using a SQL pipeline can help you improve performance by eliminating unnecessary steps. This is because an SQL pipeline can read and write data directly to the destination without having to create intermediate datasets, which can save time and resources, as well as improve the accuracy of your results.
Additionally, a SQL pipeline can help you optimize your data storage capacity. This is because you can use the pipeline to delete or archive data that is no longer needed. This can free up space on your storage systems, and it can also help speed up performance.
Building efficient and flexible SQL pipelines can be challenging, especially as organizations' needs change quickly. However, by carefully planning and designing your pipelines, you can create pipelines that can adapt to even the most complex data needs.
In this lab, you'll manage data and use SQL to build an efficient and flexible pipeline that addresses a business need.
Scenario
In recent years, TheLook eCommerce's profits have soared thanks to online shopping. But delivery times have not kept up, and customer satisfaction has decreased.
As a cloud data analyst for TheLook eCommerce, you have been asked to collaborate with Kai, the head of the logistics team, to develop a data pipeline to collect, clean, transform, and load data about customer deliveries, including the distance traveled from the distribution center to each customer.
This information will help the logistics team determine the ways they can improve delivery times and increase customer satisfaction, such as whether to open new distribution centers, relocate existing distribution centers, or invest in new transportation methods.
You'll apply your BigQuery and SQL skills to design a flexible pipeline that provides the logistics team with reliable data to better monitor delivery performance, and can be easily updated as the logistic team’s data needs change.
First, you'll create a dataset and define table schemas for data that will be ingested. Next, you'll perform and explore a series of transformations. Then, you'll apply the transformations to the data before loading the transformed data into newly defined tables. Finally, you'll formalize those queries into a stored procedure.
Setup
Before you click Start Lab
Read these instructions. Labs are timed and you cannot pause them. The timer, which starts when you click Start Lab, shows how long Google Cloud resources will be made available to you.
This practical lab lets you do the activities yourself in a real cloud environment, not in a simulation or demo environment. It does so by giving you new, temporary credentials that you use to sign in and access Google Cloud for the duration of the lab.
To complete this lab, you need:
- Access to a standard internet browser (Chrome browser recommended).
- Time to complete the lab---remember, once you start, you cannot pause a lab.
How to start your lab and sign in to the Google Cloud console
-
Click the Start Lab button. On the left is the Lab Details panel with the following:
- Time remaining
- The Open Google Cloud console button
- The temporary credentials that you must use for this lab
- Other information, if needed, to step through this lab
Note: If you need to pay for the lab, a pop-up opens for you to select your payment method. -
Click Open Google Cloud console (or right-click and select Open Link in Incognito Window) if you are running the Chrome browser. The Sign in page opens in a new browser tab.
Tip: You can arrange the tabs in separate, side-by-side windows to easily switch between them.
Note: If the Choose an account dialog displays, click Use Another Account. -
If necessary, copy the Google Cloud username below and paste it into the Sign in dialog. Click Next.
You can also find the Google Cloud username in the Lab Details panel.
- Copy the Google Cloud password below and paste it into the Welcome dialog. Click Next.
You can also find the Google Cloud password in the Lab Details panel.
- Click through the subsequent pages:
- Accept the terms and conditions
- Do not add recovery options or two-factor authentication (because this is a temporary account)
- Do not sign up for free trials
After a few moments, the Console opens in this tab.

Task 1. Create a dataset
In this task, you'll create a dataset in the existing project, and define the schema and data types.
- In the Cloud console, from the Navigation menu (
), select BigQuery.
The Navigation menu, Explorer pane, and Query Editor display.
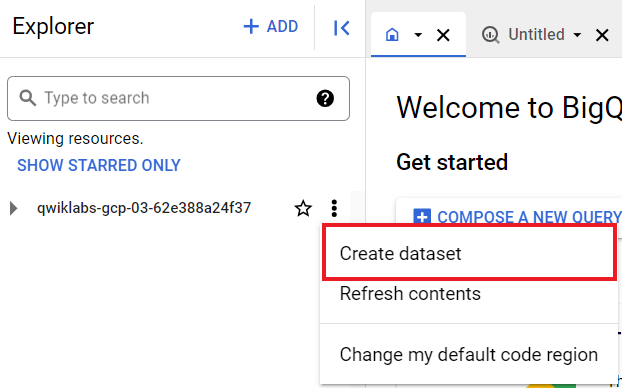
- Click on the View actions icon (
) next to your Project ID and click Create dataset.
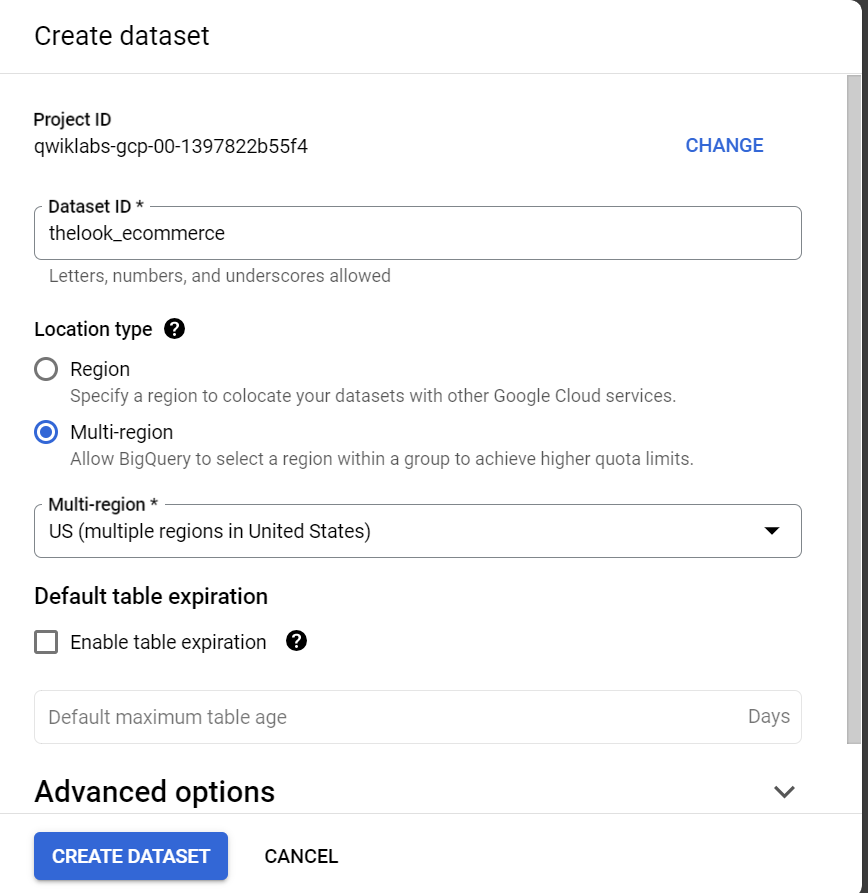
- Set the Dataset ID to thelook_ecommerce. Verify the location is set to US and leave the other fields at their default values.
- Click Create dataset.
You'll now have the thelook_ecommerce displayed under your project name.
- In the Query Editor, click on the Compose new query (+) icon to open a new Untitled tab to run the query in.
- Copy and paste the following query on the Untitled query tab to create the
product_order_fulfillmenttable:
- Click Run.
- Click Go To Table to explore the table schema and data types that have been created.
While this dataset is currently empty, it is the location where the data will be populated once it is loaded.
Click Check my progress to verify that you have completed this task correctly.
Task 2. Create a table from query results
Your analysis is expanding to include analyzing the proximity of distribution centers to the customers placing orders. To do this, you’ll need to calculate values based on geographic locations.
In this task, you’ll create geometric points from the latitude and longitude values provided in the original users and distribution_centers tables.
- Copy the following query into the Query Editor:
--Create empty customers table CREATE OR REPLACE TABLE `thelook_ecommerce.customers` ( id INT64, first_name STRING, last_name STRING, email STRING, age INT64, gender STRING, state STRING, street_address STRING, postal_code STRING, city STRING, country STRING, traffic_source STRING, created_at TIMESTAMP, latitude FLOAT64, longitude FLOAT64, point_location GEOGRAPHY); --Create empty centers table CREATE OR REPLACE TABLE `thelook_ecommerce.centers` ( id INT64, name STRING, latitude FLOAT64, longitude FLOAT64, point_location GEOGRAPHY);
This query creates the table definitions for both the customers and centers tables, which will include the original columns from the users and distribution_centers tables. This query also adds a point_location column to both tables; these point_location columns will have the data type set to Geography.
- Click Run.
Click Check my progress to verify that you have completed this task correctly.
Task 3. Perform a transformation on BigQuery data
In this task, you'll create point geometries using the ST_GEOGPOINT geography function, where you call ST_GEOGPOINT(lon, lat).
First, run the following SQL queries to create and populate the centers and customers tables. These queries load the data from a SELECT statement, given that the original location (longitude, latitude) of the data is in the BigQuery thelook_ecommerce public dataset.
A Google public dataset is any dataset that is stored in BigQuery and made available to the general public through the Google Cloud Public Dataset Program. Public datasets make it easy to easily use readily available public data within BigQuery without having to load and maintain it.
- Copy the following query into the Query Editor:
This query loads the centers table, including the geography transformation.
- Click Run.
- Now, copy the following query into the Query Editor:
This query loads the customers table including the geography transformation.
- Click Run.
Next, you'll need to calculate the data values for analysis.
Since the relationship between customers and distribution centers is important, you'll use these geographic point locations to calculate the closest distribution center to each customer and the distance of those locations.
To do so, use the geography function, ST_DISTANCE, to calculate the minimum distance between a customer location and a center.
- Copy the following scalar subquery into the Query Editor:
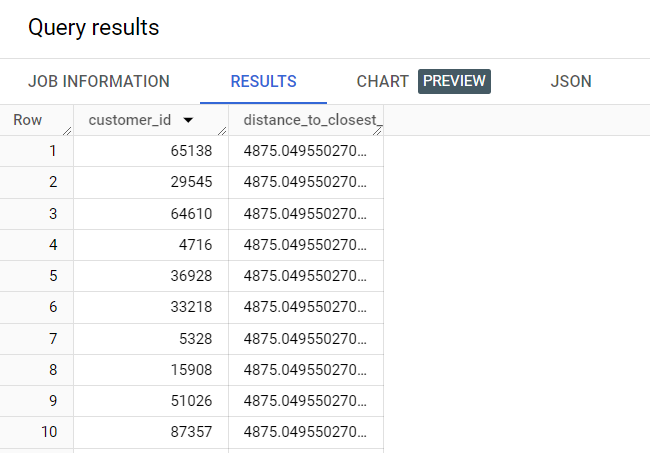
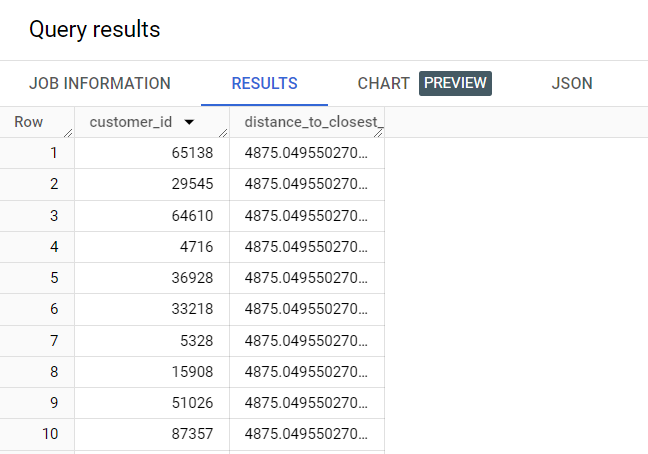
This query calculates the distance in kilometers.
- Click Run.
As displayed in the screenshot, the query returns the distance between each customer and the nearest distribution center. Take a moment to review the SELECT statement to understand how it derives the distance calculation.
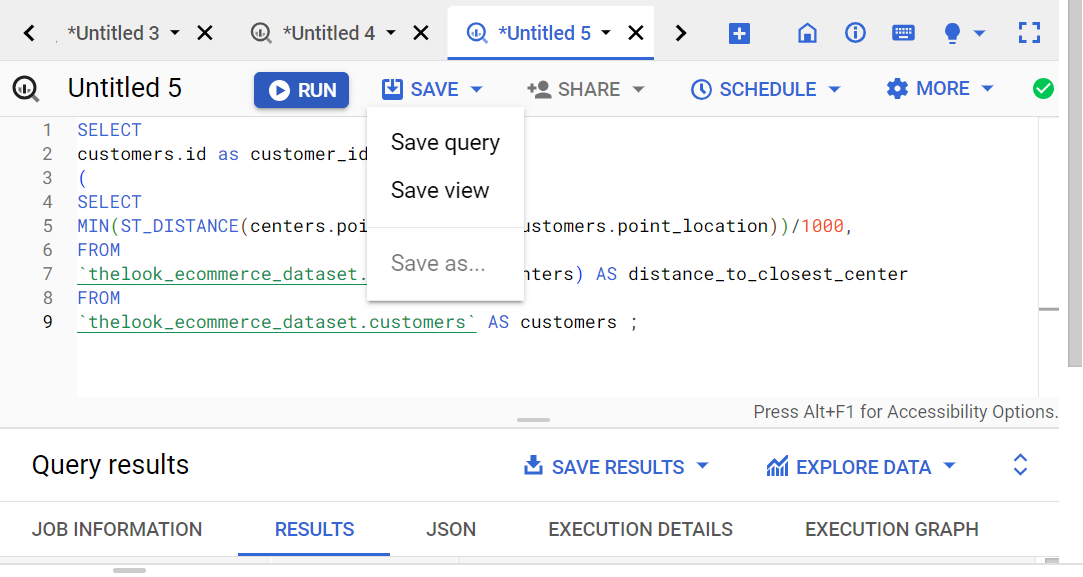
- Expand the Save dropdown, and select Save query.
The Save query dialog opens.
- In the Name field, type Calculate Customer Distance to Closest Center. Leave the remaining settings as their defaults.
- Click Save.
- In the Explorer pane, double-click the saved query in the Saved queries dropdown to rerun the query.
Click Check my progress to verify that you have completed this task correctly.
Task 4. Create a stored procedure to ensure easier updates
A stored procedure is a set of SQL statements that are stored in a database and can be executed as a single unit.
In this task, you'll create a stored procedure to include all of the table definitions, transformations, and ingest statements you have manually and sequentially generated so far in Tasks 1 - 3.
To create a stored procedure (in this case, sp_create_load_tables), add the CREATE OR REPLACE PROCEDURE statement at the beginning of your script, followed by the name of the stored procedure and the BEGIN statement. Once you have added all of the components of the procedure, add the END statement.
To add to the procedure, you can place your table definitions and your data ingest portions. You can put all your table definitions upfront, or you can cluster them by table, depending on your preference. In this lab, however, each table definition is followed by the data ingestion portion and any other transformations done in previous steps.
You could also create columns in your customer table that could store the calculated distance_to_closest_center and the closest_centervalues. The elegance of the procedure is that if the schema changes, or if you want to include additional columns or generate calculated columns, you can easily add these to or update the stored procedure. Once updated, the stored procedure can be set to run on a regular basis.
Now, create a stored procedure that will execute all the steps you have previously ran in Tasks 1 -3, as a single unit. The following code, when executed, will update the tables and populate them appropriately.
- Copy the following query into a new Untitled query tab:
- Click Run.
Please note: the stored procedure creates all the necessary tables and populates them with the transformed data. However, the stored procedure does not return the query results that show the distance between customers and their nearest distribution. Go to Step 7 below to do that.
- Expand the Save dropdown, and select Save query. The Save query dialog opens.
- In the Name field, type sp_create_load_tables. Leave the remaining settings as their defaults.
- Click Save. This stored procedure will display in the Routines section of the dataset:
- Click Run to run this stored procedure.
As shown in Step 5 of Task 3 above, run the SELECT SQL statement to get the distance between each customer and their nearest distribution center.
- Copy the following scalar subquery into the Query Editor:
This query calculates the distance in kilometers.
- Click Run.
Click Check my progress to verify that you have completed this task correctly.
To set up a scheduled query, you can simply click Schedule within the Query Editor. The New schedule query window opens, with several query details for you to specify. You can do this with any query that needs to be updated regularly.
Conclusion
Great work!
You have successfully used SQL and BigQuery to create a simple and flexible data pipeline that meets a business need.
First, you created a dataset and defined table schemas for data that will be ingested. Next, you performed and explored a series of transformations.
Then, you applied the transformations to the data before loading the transformed data into newly defined tables.
Finally, you formalized those queries into a stored procedure to include calculated values of interest, and how to set up scheduled queries for regular updates.
Through this lab, you've learned the importance of creating datasets and defining table schemas for the data they contain. By running and examining a series of transformations, you've developed the skills to apply transformations to data before loading the transformed data into newly defined tables. You also learned how to formalize these queries into a stored procedure to include calculated values of interest and how to set up scheduled queries for regular updates.
You're well on your way to understanding how BigQuery can be used to create and manage SQL pipelines.
End your lab
Before you end the lab, make sure you’re satisfied that you’ve completed all the tasks. When you're ready, click End Lab and then click Submit.
Ending the lab will remove your access to the lab environment, and you won’t be able to access the work you've completed in it again.
Copyright 2024 Google LLC All rights reserved. Google and the Google logo are trademarks of Google LLC. All other company and product names may be trademarks of the respective companies with which they are associated.
