체크포인트
Find datasets in Analytics Hub
/ 50
Bringing it all together
/ 50
Navigate Dataplex
 IMPORTANT:
 Make sure to complete this hands-on lab on a desktop/laptop only.
 There are only 5 attempts permitted per lab.
 As a reminder – it is common to not get every question correct on your first try, and even to need to redo a task; this is part of the learning process.
 Once a lab is started, the timer cannot be paused. After 1 hour and 30 minutes, the lab will end and you’ll need to start again.
 For more information review the Lab technical tips reading.
Activity overview
Dataplex is a powerful tool that simplifies data management across data lakes, data warehouses, and data marts. It provides consistent controls and makes it easy to navigate complex data environments, significantly reducing the time and effort required to find the right data for analysis.
One of the key features of Dataplex is its user-friendly interface, which enables you to easily search for data sources across data warehouses and data lakes. With support for various services such as BigQuery and Dataproc, Dataplex empowers you to efficiently identify and manage data sources in an integrated manner.
In this lab, you’ll use the built-in search in BigQuery, Dataplex, and the Analytics Hub to identify data sources. As a data analyst, this skill can greatly enhance the efficiency and accuracy of your data analysis processes.
Scenario
Meredith is the lead merchandiser for TheLook eCommerce, a global clothing company that specializes in innovative fashion and ethical and sustainable sourcing. Meredith is interested in exploring the potential impact of weather on t-shirt sales. Specifically, they want to generate a report that contains a list of the most recent orders, along with the product brand and temperature range.
Meredith asked for your help to identify the appropriate data sources that they can use to generate the desired report. You'll use Dataplex to identify tables in BigQuery that contain order and brand information, as well as public datasets that include temperature data.
Here’s how you'll do this task: First, you’ll use BigQuery to search for tables that contain the word "orders" or "brand". Second, you’ll search for the Brand data in Dataplex. Third, you’ll search for temperature data from Public Datasets in BigQuery. Fourth, you’ll use Lineage to search for the source of the product name data. Finally, you’ll demonstrate that you have access to all the necessary data required for Meredith’s report.
Setup
Before you click Start Lab
Read these instructions. Labs are timed and you cannot pause them. The timer, which starts when you click Start Lab, shows how long Google Cloud resources will be made available to you.
This practical lab lets you do the activities yourself in a real cloud environment, not in a simulation or demo environment. It does so by giving you new, temporary credentials that you use to sign in and access Google Cloud for the duration of the lab.
To complete this lab, you need:
- Access to a standard internet browser (Chrome browser recommended).
- Time to complete the lab---remember, once you start, you cannot pause a lab.
How to start your lab and sign in to the Google Cloud console
-
Click the Start Lab button. On the left is the Lab Details panel with the following:
- Time remaining
- The Open Google Cloud console button
- The temporary credentials that you must use for this lab
- Other information, if needed, to step through this lab
Note: If you need to pay for the lab, a pop-up opens for you to select your payment method. -
Click Open Google Cloud console (or right-click and select Open Link in Incognito Window) if you are running the Chrome browser. The Sign in page opens in a new browser tab.
Tip: You can arrange the tabs in separate, side-by-side windows to easily switch between them.
Note: If the Choose an account dialog displays, click Use Another Account. -
If necessary, copy the Google Cloud username below and paste it into the Sign in dialog. Click Next.
You can also find the Google Cloud username in the Lab Details panel.
- Copy the Google Cloud password below and paste it into the Welcome dialog. Click Next.
You can also find the Google Cloud password in the Lab Details panel.
- Click through the subsequent pages:
- Accept the terms and conditions
- Do not add recovery options or two-factor authentication (because this is a temporary account)
- Do not sign up for free trials
After a few moments, the Console opens in this tab.

Task 1. Search datasets in BigQuery
In this task, you’ll search available source tables that contain the brand and order information Meredith needs for their report. To do this, you’ll use BigQuery to search for tables that contain the words orders or brand.
- In the Google Cloud console, in the Navigation menu (
), select BigQuery.
- In the Explorer search field, type order, and press ENTER.
The console will list the order_items, orders and orders_by_state tables as the search results.
Next, search for tables that contain Brand data.
- In the Explorer search box, type brand, and press ENTER.
No results are returned for the search in this instance.
Task 2. Find datasets in Dataplex
You need to find the brand data, but searching through each source and column to locate brand data is time-consuming. So, you ask Artem, the data architect, for help. They recommend using Dataplex, the company's most up-to-date data catalog, to find the information you need.
In this task, you’ll search for the brand data in Dataplex.
- In the Google Cloud console title bar search field, type Dataplex.

- From the search results, select Dataplex.
- In the navigation pane, in the Discover section, select Search if the Search page is not automatically loaded.
- In the Find data across your projects and organizations search field, type brand, and press ENTER.
Where the search for brand did not return a result in BigQuery, it returns the tables that contain brand data in Dataplex. This is because Dataplex has the capability to search for column names and descriptions within tables.
- Select the products table from the search results.
- On the products page, note the Last modification time. This will indicate how current the data is.
- In the Labels field, click Edit in BigQuery. This action will open a new browser window, displaying the products table in BigQuery.
- Click the Preview tab to examine the data.
- Examine the brand column. This is the data that Meredith needs to add brand-related information to the orders report.
Items in an order are in the order_items table. To get a report with items ordered, like t-shirts, with brand information, you need to connect the order_items table with the products table. To connect both tables, you need to find a common column.
-
In the Explorer area, expand the thelook_gcda dataset to display the list of tables.
-
Click on the order_items table. The Schema tab is displayed. Examine the column list to answer the next question.
Task 3. Find datasets in Analytics Hub
Meredith requested temperature range information on the report, but Artem says this data is not available in the lakehouse. So, you search the Internet and learn BigQuery has public datasets available.
In this task, you’ll search for temperature data from public datasets in BigQuery.
- On the Explorer bar, click + Add to add a data source to the project.
- On the Add page, in the Additional sources list, select Analytics Hub. The Analytics Hub page opens, listing the shared data sources.
- In the search field, type weather, and press ENTER.
- Select GHCN Daily provided by NOAA. This dataset contains daily climate summaries from land surface stations across the globe.
- On the GHCN Daily page, click + Add dataset to project.
-
On the Create linked dataset page, click Save.
-
On the Explorer pane, in the list of datasets, expand the ghcn_daily dataset.
-
Select the ghcnd_1763 table.
-
Select the Preview tab to examine the data. The TMAX values displayed in the element column represent the maximum temperature values for a specific day.
-
Collapse the ghcn_daily dataset. This step is to hide the tables in ghcn_daily dataset and make the thelook_gcda dataset visible for the next task.
Click Check my progress to verify that you have completed this task correctly.
Task 4. Identify data sources with lineage
Meredith is concerned about a report that relies on the on_hand_inventory table and asks about the source of the product names. Meredith mentions they have had trouble with inaccurate product names in the past.
Meredith wants clarification on the origin of the product name data used in the product_name_logistics column within the on_hand_inventory table. It is important to note that the on_hand_inventory table is generated hourly and is derived from other tables.
In this task, you’ll use Lineage to determine the table and column that is used to populate product name data in the product_name_logistics column.
- In the list of datasets, expand the thelook_gcda dataset, and select the on_hand_inventory table.
- Select the Lineage tab.
Once the Lineage tab is populated, a graph similar to the following will display:
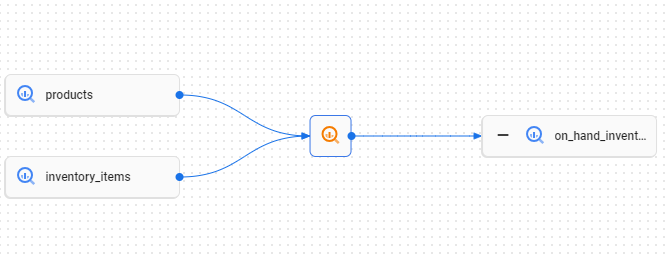
The flow diagram displays the flow lines of data from the products and inventory_items tables to the on_hand_inventory table. This means that the data contained in the on_hand_inventory table originated from the products and inventory_items tables.
- Click the orange magnifying glass linked to the products and inventory_items tables. The orange magnifying glass indicates a SQL transformation between the sources on the left and the table on the right.
The query that generated the on_hand_inventory table is displayed in the Query pane.
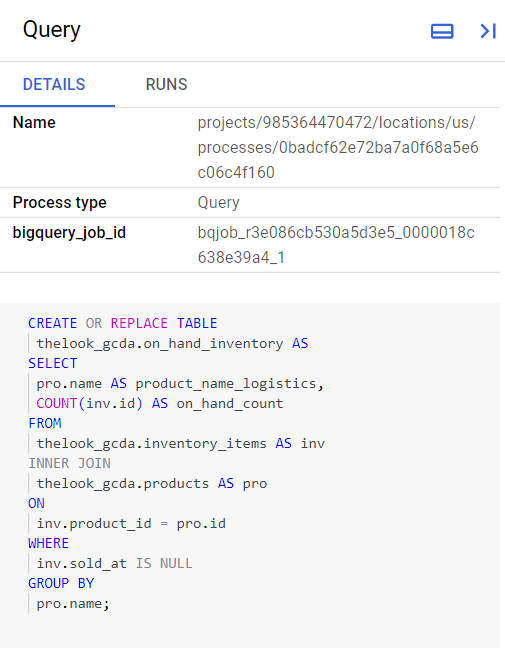
Note the two tables you identified in the diagram after the FROM clause of the query: inventory_items and products. Queries sometimes specify an alias, or nickname, for tables. An alias is defined after the keyword AS, for example, in this query the inventory_items table has the alias inv. Table aliases help in keeping the code compact, and can be used to specify where a column comes from in the SELECT part of the query. For example, inv.id is the column id that comes from the table that has the alias inv.
The SELECT clause of a query can be used to rename a column in the output. For example, the formula COUNT(inv.id) is renamed to on_hand_count.
Data lineage shows which column and table is the source for product name in the output product_name_logistics.
Task 5. Bringing it all together
Meredith has asked you to make sure that you have all the data needed for them to complete their report.
In this task, you’ll run 5 queries to display the brand, orders, order_items, weather, product_id and product_name data and have all the information you need for Meredith’s report.
Display brand data
First, run a query that returns the first 10 rows from the products table that contain brand information.
- In the BigQuery Studio, click the Query button to open the query editor, and select In a new tab. A pre populated Untitled tab opens.
- Replace the default text in the Untitled tab with the following SQL query:
- Click Run.
Display orders data
Next, run a query that retrieves the first 10 rows of data from the orders table.
- Copy the following query into Query Editor:
- Click Run.
Display order items data
Third, run a query that retrieves the first 10 rows from the order_items table.
- Copy the following query into Query Editor:
- Click Run.
Display weather data
Fourth, run a query that returns the first 10 rows from the ghcnd_1763 table of Weather data.
- Copy the following query into Query Editor:
- Click Run.
Display product data
Finally, run a query that retrieves the first 10 rows from the products table, using aliases for the product name and ID.
- Copy the following query into Query Editor:
This query retrieves the product names and IDs from the products table in the thelook_gcda dataset. It obtains a subset of columns in the table returning only the product names and IDs using aliasing to change the column names that are returned.
- Click Run.
Click Check my progress to verify that you have completed this task correctly.
Conclusion
Great work!
You now have practical experience in using BigQuery, Dataplex, the Analytics Hub, and Dataplex to identify data sources in BigQuery. Dataplex provides a user-friendly interface for identifying data sources across complex environments, while BigQuery allows you to search for specific tables and access the required data for analysis.
By using these tools effectively, you quickly found and previewed the necessary data. This helped Meredith have all the data they needed to complete their report that includes a list of the most recent orders, the product brand, and temperature range.
You’re well on your way to understanding how to find datasets in BigQuery, Dataplex, and Analytics Hub.
End your lab
Before you end the lab, make sure you’re satisfied that you’ve completed all the tasks. When you're ready, click End Lab and then click Submit.
Ending the lab will remove your access to the lab environment, and you won’t be able to access the work you've completed in it again.
Copyright 2024 Google LLC All rights reserved. Google and the Google logo are trademarks of Google LLC. All other company and product names may be trademarks of the respective companies with which they are associated.